Latest News
Total Rewards & 2019 Economic Forecasts in a Turbulent Canadian Economy
Prepared By: The Wynford Group
The results included within this summary are based on over 250 participants in the 2019 Fall Flash Compensation Projections Survey.
The survey was initiated between October and November 2018 and reflects organization submissions across Canada.
The Wynford Group conducts a flash surveys every spring and fall to provide a snapshot on compensation and human capital trends.
The purpose is to provide our participants with the most up-to-date compensation information available and receive a pulse on employer practices across Canada.
This summary provides 2019 base salary projections by region, industry, an economic outlook forecast,
human capital practices and human capital management strategies currently employed by human resources departments across the country.
We hope that you find the Fall Flash survey results useful as your company moves forward into 2019.
The Wynford Group encourages you to contact us for more information on how we can work with your organization in addressing its totals rewards and compensation needs.
If you require more in-depth data, Wynford's annual Canadian Salary Surveys are available online.
For more detailed insights and in-depth data, please see our annual Canadian Salary Surveys.
Please click here for more information.
Actual 2019 Salary Increases - Including Zero's
Average Regional 2019 Base Salary Projections:
|
National |
2.50 |
|
British Columbia |
2.60 |
|
Alberta |
2.45 |
|
Saskatchewan |
2.36 |
|
Manitoba |
2.42 |
|
Ontario |
2.50 |
|
Quebec |
2.57 |
|
Atlantic |
2.44 |
|
Northern Canada |
2.48 |
2019 Base Salary Greatest Increase by Industry including 0's (%):
|
|
Highest |
|
Lowest |
|
Software Development |
3.17 |
IT Service |
2.19 |
|
Advanced Technology |
3.00 |
Logistics/Transportation/Distribution |
2.18 |
|
Mining |
2.69 |
Hospitality |
2.10 |
|
Professional Services |
2.65 |
EPC/EPCM |
2.00 |
|
Manufacuring |
2.60 |
Public Sector |
1.85 |
Economic Outlook
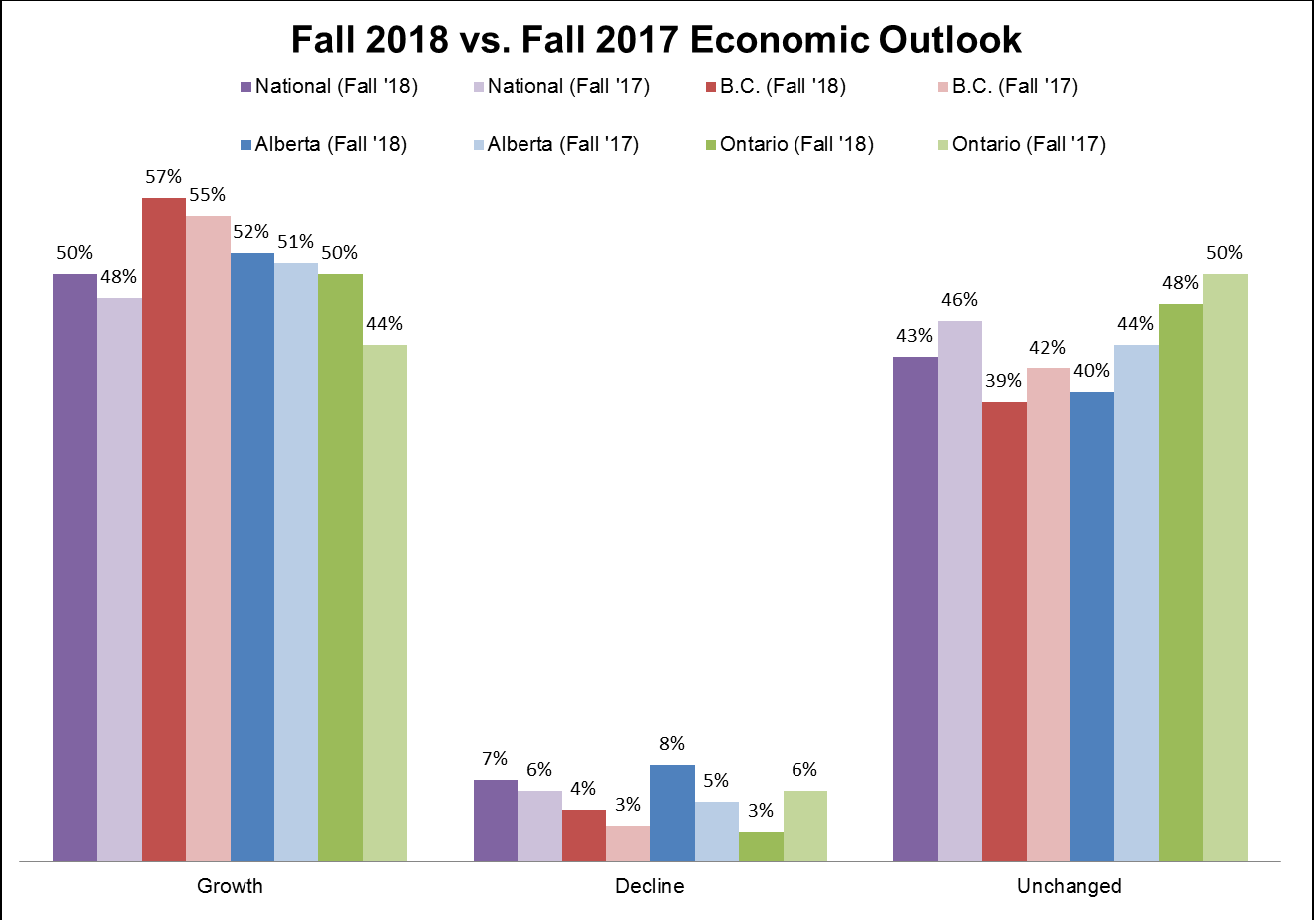
The graph above highlights several aspects of how the participants view the Canadian economy in 2019:
Human Capital Practices
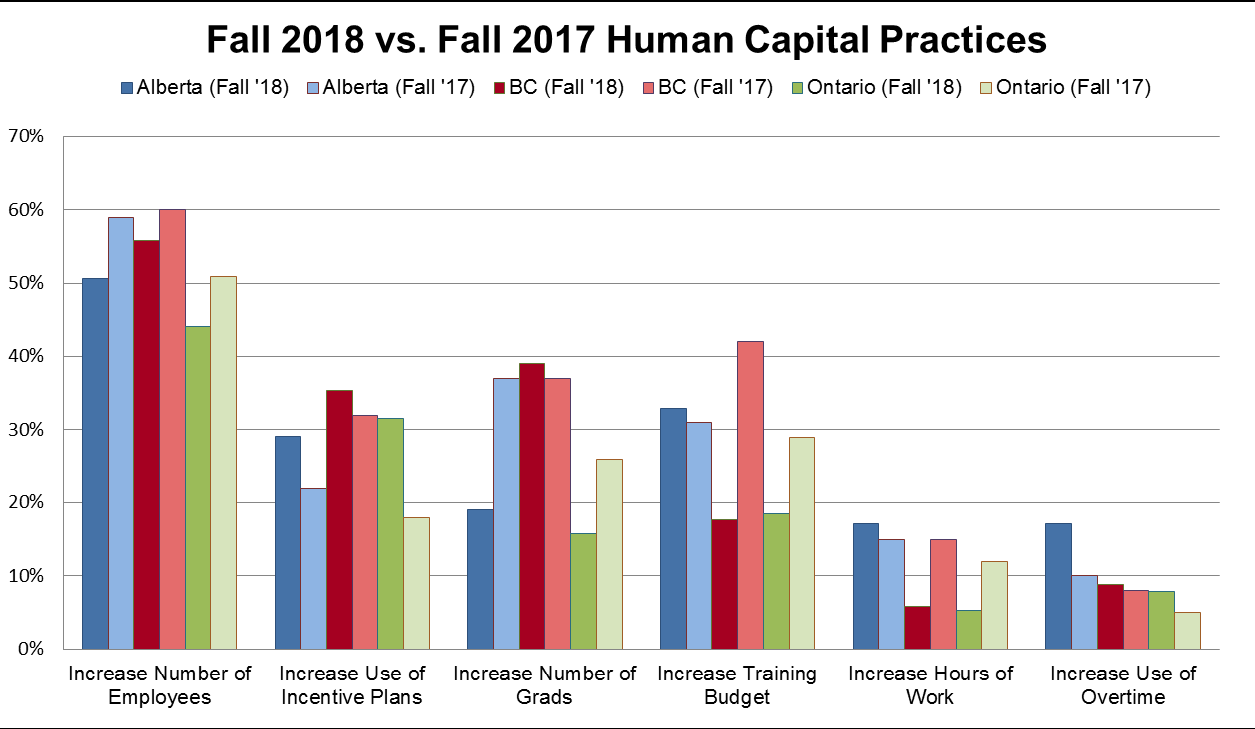
Helping to highlight Canada's optimism 2019 is the Human Capital Practices graph above.
- Over 50% of participants from Alberta are anticipating their organizations will increase the number of employees in 2019. In addition to an expanding workforce, over 30% are looking to increase their training budget which is often an indicator of developing a broader range of skills in a volatile economy.
- Over 55% of participants in British Columbia are anticipating an increase in number of employees, including a minor rise in number of new grads since last fall.
- Ontario's increase in number of employees sits below 50% due to a high number of organizations reporting "no change" in this category with possible concern over U.S. economic strategies.
- Across Canada, many organizations are adapting their compensation programs by increasing incentive programs. The increase suggests organizations across the country are moving towards pay for performance and more closely managing base pay expenses.
- A stronger increase in use of overtime in Alberta allows for flexibility in a volatile economy.
- Stable increases in the hiring of new grads/interns and training budgets are both lead indicators of positive economic growth.
Human Capital Cost Management Strategies
A function of this survey is not only to report on what organization's expect of the economy, but how they are dealing with these expectations in terms of their human capital. Over the past few years, we have seen many organizations employ cost saving practices in order to control uncertainty of the economy or the industry they operate in. The fact that many of these strategies are still in place suggests they may be a part of the "new normal" in managing costs. These strategies are highlighted in the graph below.
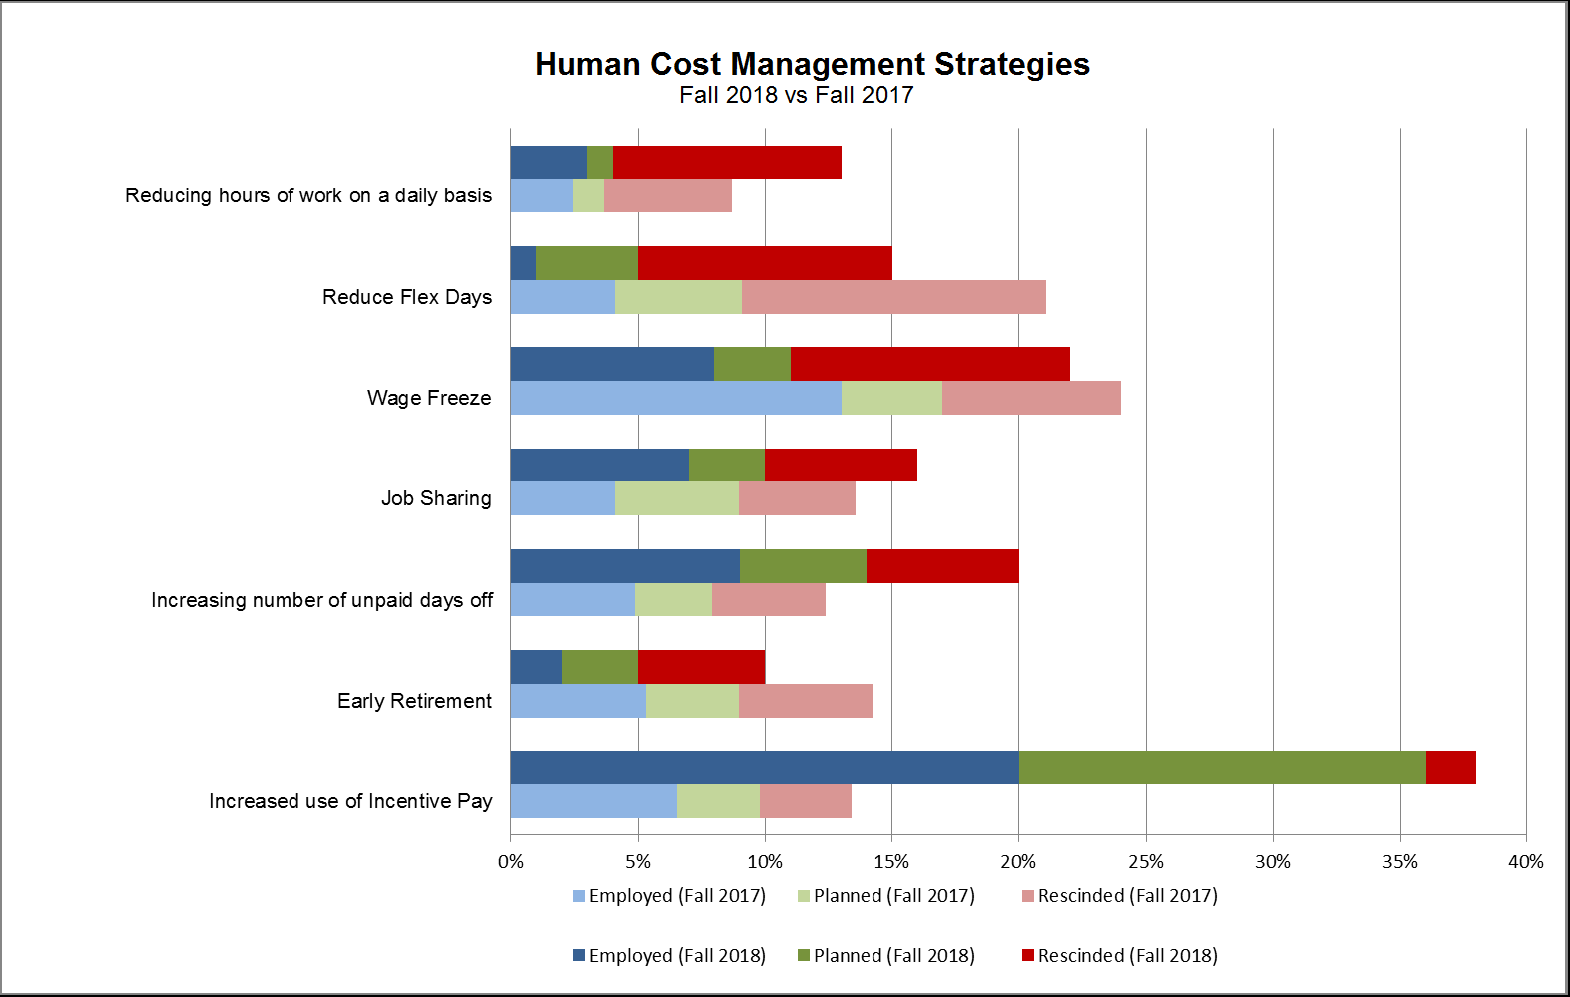
The good news is that more participants have rolled back wage freezes, reduced early retirement and increased the use of incentive pay in 2019.
- Less than 25% of organizations have (or plan on) implementing wage freezes.
- Large increases in the use of incentive pay suggests that pay for performance is becoming more common which supports that many organizations are examining base pay expenditures more closely. Incentive pay typically helps build employee morale and ensures that employees feel appreciated for their contributions in the workplace.
- Fewer organizations are reducing amount of hours of work on daily basis which is also encouraging for employees.
Need more in-depth data?
Wynford's 2018 Canadian Salary Surveys and National Construction & Mining Surveys are currently available online! Our user friendly cash data reports are broken down by three simple features including: Location, Industry and Revenue/Organization size.
Error processing SSI file