News
A snapshot of Canada's Dynamic Environment
Compensation Trends and Forecasts for Summer 2018
Prepared By: The Wynford Group
The results included in this report are based on over 200 company submissions across Canada for the 2018 Spring Flash Survey between the months of April to June.
The Wynford Group conducts FREE flash surveys every Spring and Fall to provide a snapshot on current compensation and human capital trends. The focus of this summary report is on salary increases implemented for 2018,
as well as human capital management strategies currently in use across Canada.
We hope that you find these results useful as your organization moves further into 2018.
The Wynford Group encourages you to contact us for more information on how we can work with your organization in addressing totals rewards and compensation needs.
For more detailed insights and in-depth data, please see our annual Canadian Salary Surveys.
Please click here for more information.
Actual 2018 Salary Increases - Including Zero's
Average Regional 2018 Base Salary Increases: including 0's (%):
|
National |
2.43 |
|
British Columbia |
2.58 |
|
Alberta |
2.39 |
|
Saskatchewan |
2.30 |
|
Manitoba |
2.47 |
|
Ontario |
2.50 |
|
Quebec |
2.48 |
|
Atlantic |
2.30 |
|
Ontario |
2.37 |
2018 Base Salary Greatest Increases by Industry including 0's (%):
|
Software Development |
3.00 |
|
Energy Services |
2.53 |
|
Manufacturing |
2.50 |
|
Advanced Technology |
2.46 |
|
Financial |
2.56 |
2018 Base Salary Smallest Increases by Industry including 0's (%):
|
Not For Profit |
1.89 |
|
Public Sector |
2.00 |
|
Mining |
2.00 |
|
EPC / EPCM |
2.06 |
|
Telecommunications / Utility |
2.11 |
Economic Outlook
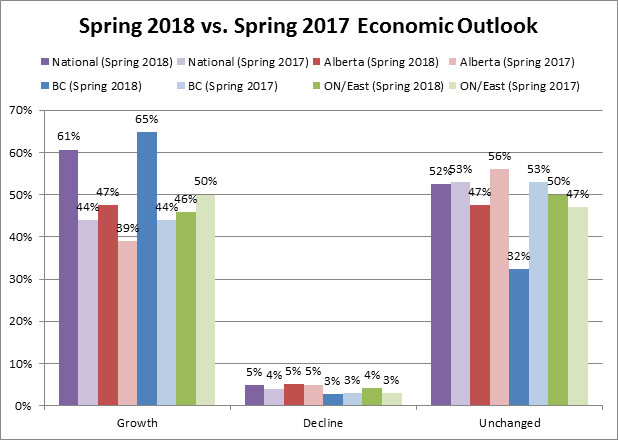
The graph above provides insight into how our participants view the Canadian economy in 2018:
Overall, these figures indicate the economy is rebounding from the recession of the past few years.
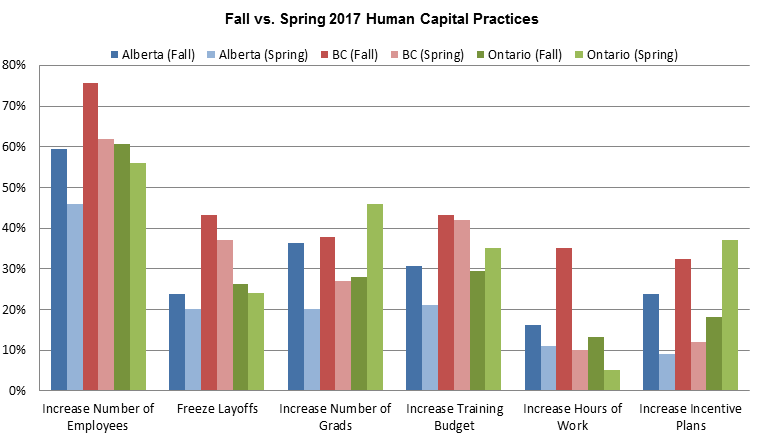
Human Capital Practices
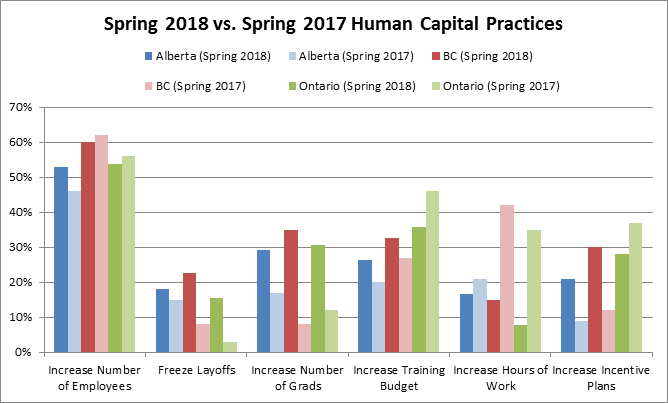
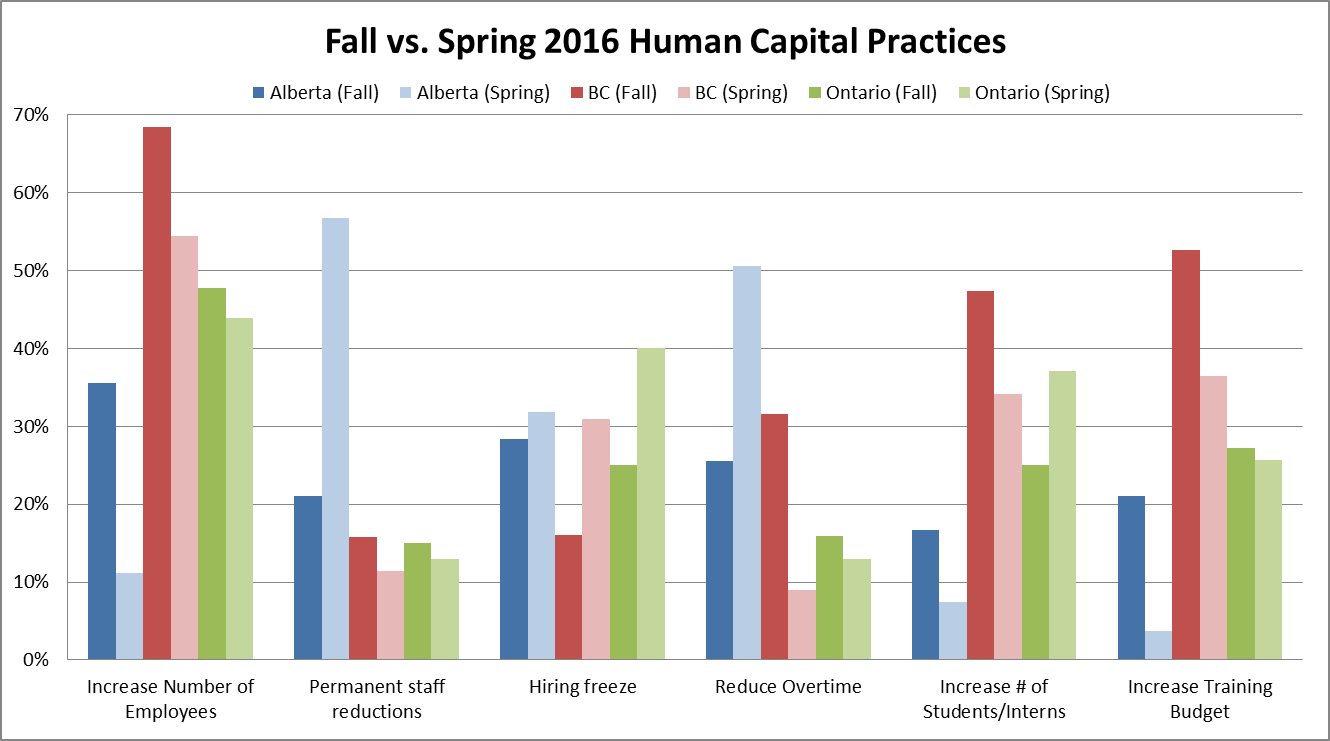
Helping to highlight the overall positive outlook of the Canadian economy for 2018 are the Human Capital Practices figures summarized in the graph above.
- Over 50% of Albertan organizations will be hiring in 2018, which represented the largest growth of more than 5% from the previous year.
- While both B.C. and Ontario indicate slight drops in employee growth, both still have over 50% of organizations in showing increases in their workforce numbers.
- The clear reduction in employment freezes and layoffs point towards strong economies across the country.
- Other positive figures such as increased hiring of graduates and increased training budgets in all areas.
- Of particular interest is the increase in training budgets and use of incentive plans in BC and Alberta, which indicates interest in longer-term retention strategies.
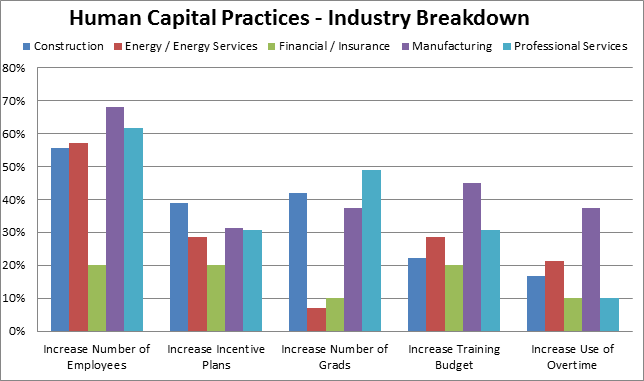
Breaking down the Human Capital Practices by industry provides an alternative perspective and shows which industries are more optimistic than others in 2018. Some of the highlights are as follows:
- Close to 70% of the participants from the manufacturing industry are reportedly increasing the number of employees in 2018 - which is over 10% higher than the other industries
- While the Construction sector is not increasing the workforce as to the extent that they did in 2017, over 40% indicated they are increasing the number new graduates.
- Overall, it appears that those industries that were hit hardest by the economic downturn are showing strong increases in hiring back employees and new graduates over the previous two years.
- The significant increase in the use of overtime for the Manufacturing sector suggests expected growth in hiring and economic growth in that sector.
Canadian Salary Survey Initial Online reports Distribution - Mid September 2018
Construction and Mining Online reports Distribution - Early October 2018
13th Annual Compensation Update Seminar
Edmonton - October 18th 2018
Calgary - October 31st 2018
Fall Flash Survey - November
Need more in-depth data? Wynford's Canadian Salary Surveys and National Construction & Mining Surveys
are just what you're looking for! Our user friendly cash data reports are broken down by three
simple features including: Location, Industry and Revenue/Organization size.
Sunny Days Ahead
Total Rewards Insights and Forecasts for 2018
Prepared By: The Wynford Group
The results included in this report are based on over 250 company submissions from across Canada between October and December.
The focus of this summary report is on salary increases for 2018, as well as human capital management strategies currently in use in today's workplace.
We hope that you find these results useful as your company moves forward into 2018.
The Wynford Group encourages you to contact us for more information on how we can work with your organization in addressing its totals rewards and compensation needs.
For more detailed insights and in-depth data, please see our annual Canadian Salary Surveys.
Please click here for more information.
Actual 2018 Salary Increases - Including Zero's
Average Regional 2018 Base Salary Increases:
|
National |
2.42 |
|
British Columbia |
2.60 |
|
Alberta |
2.35 |
|
Saskatchewan |
2.25 |
|
Ontario |
2.50 |
|
Atlantic |
2.30 |
Average 2018 Base Salary Increases by Industry:
|
|
Highest |
|
Lowest |
|
Software Development |
3.05 |
IT Service |
2.21 |
|
Professional Services |
2.75 |
Mining |
2.20 |
|
Advanced Technology |
2.57 |
Logistics/Transportation/Distribution |
2.10 |
|
Manufacturing |
2.50 |
Hospitality |
2.06 |
|
Financial |
2.45 |
EPC/EPCM |
1.92 |
Economic Outlook
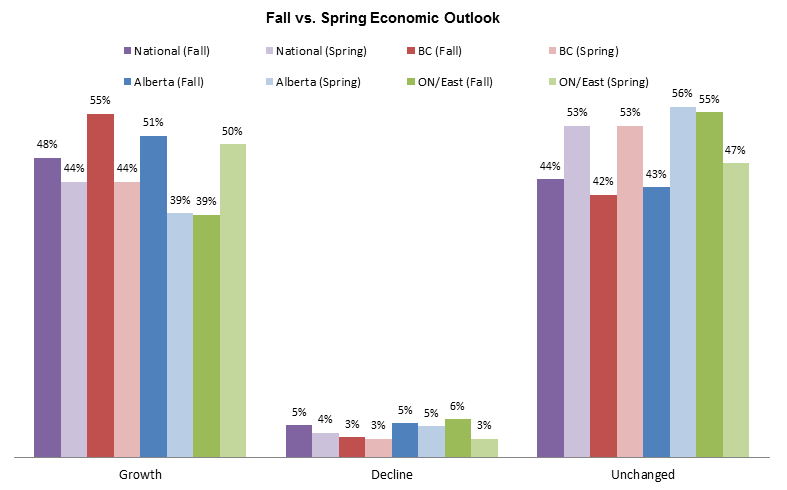
The graph above tells us several stories about how our participants view the Canadian economy in 2018:
Human Capital Practices
Helping to highlight the positive outlook of Alberta's economy for 2018 are the Human Capital Practices figures summarized in the graph above.
- Nearly 15% more Albertan organizations will be hiring in 2018, bringing the total to well over 50% of total participants.
- Other positive figures such as increased hiring of graduates, increased training budgets, and increased incentive programs all point towards a strong, rebounding Alberta economy.
- Over 75% of participants reporting from B.C. will be looking to expand their workforce in 2018, while 60% of organizations in Ontario will be doing the same.
- Large increases in hours of work, and improvements made to incentive plans will help attract and retain key talent for these B.C organizations.
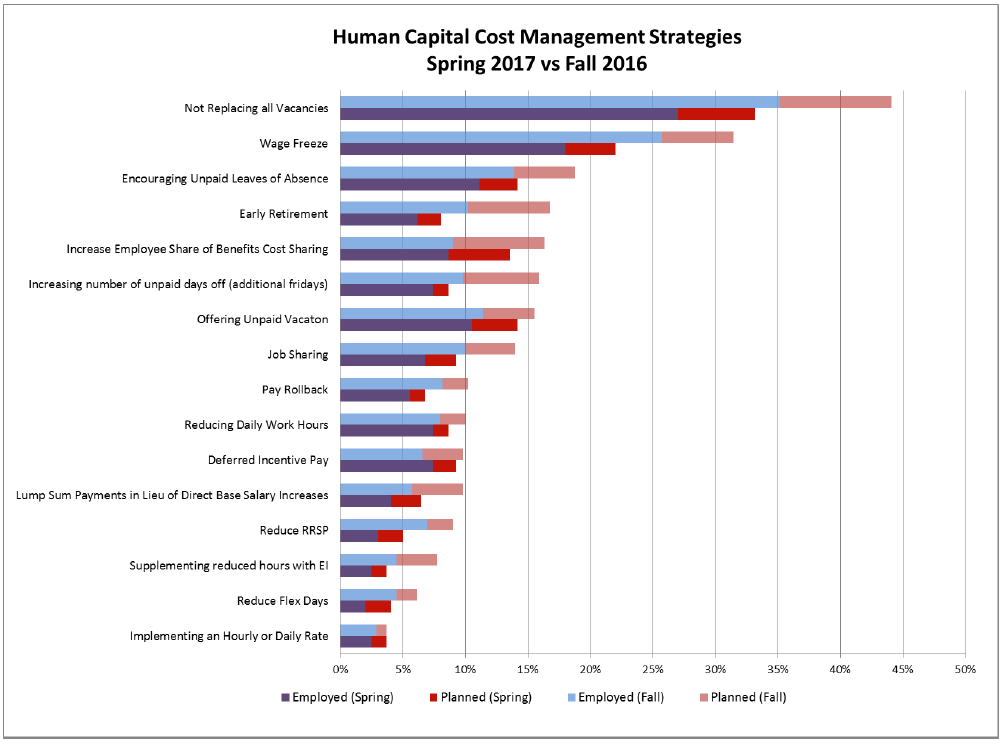
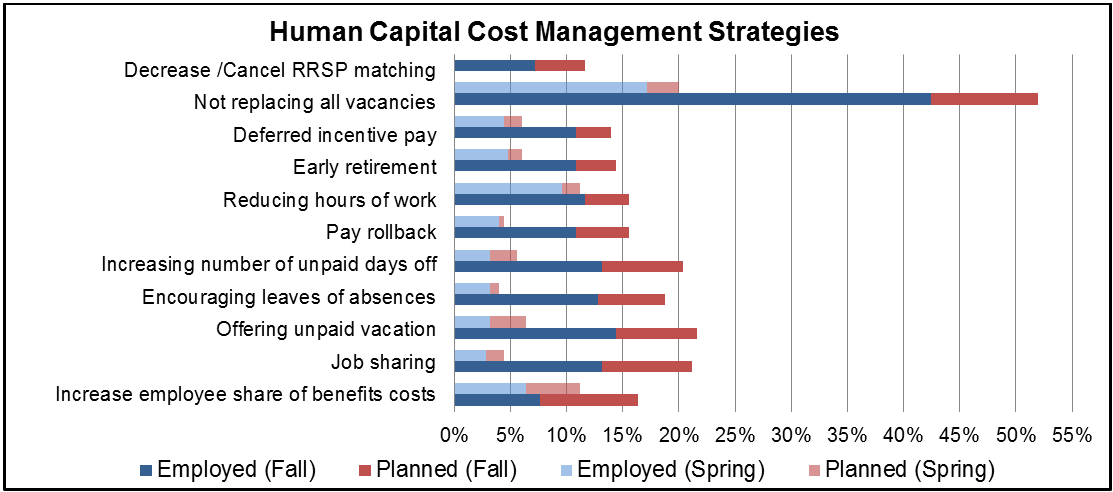
Human Capital Cost Management Strategies
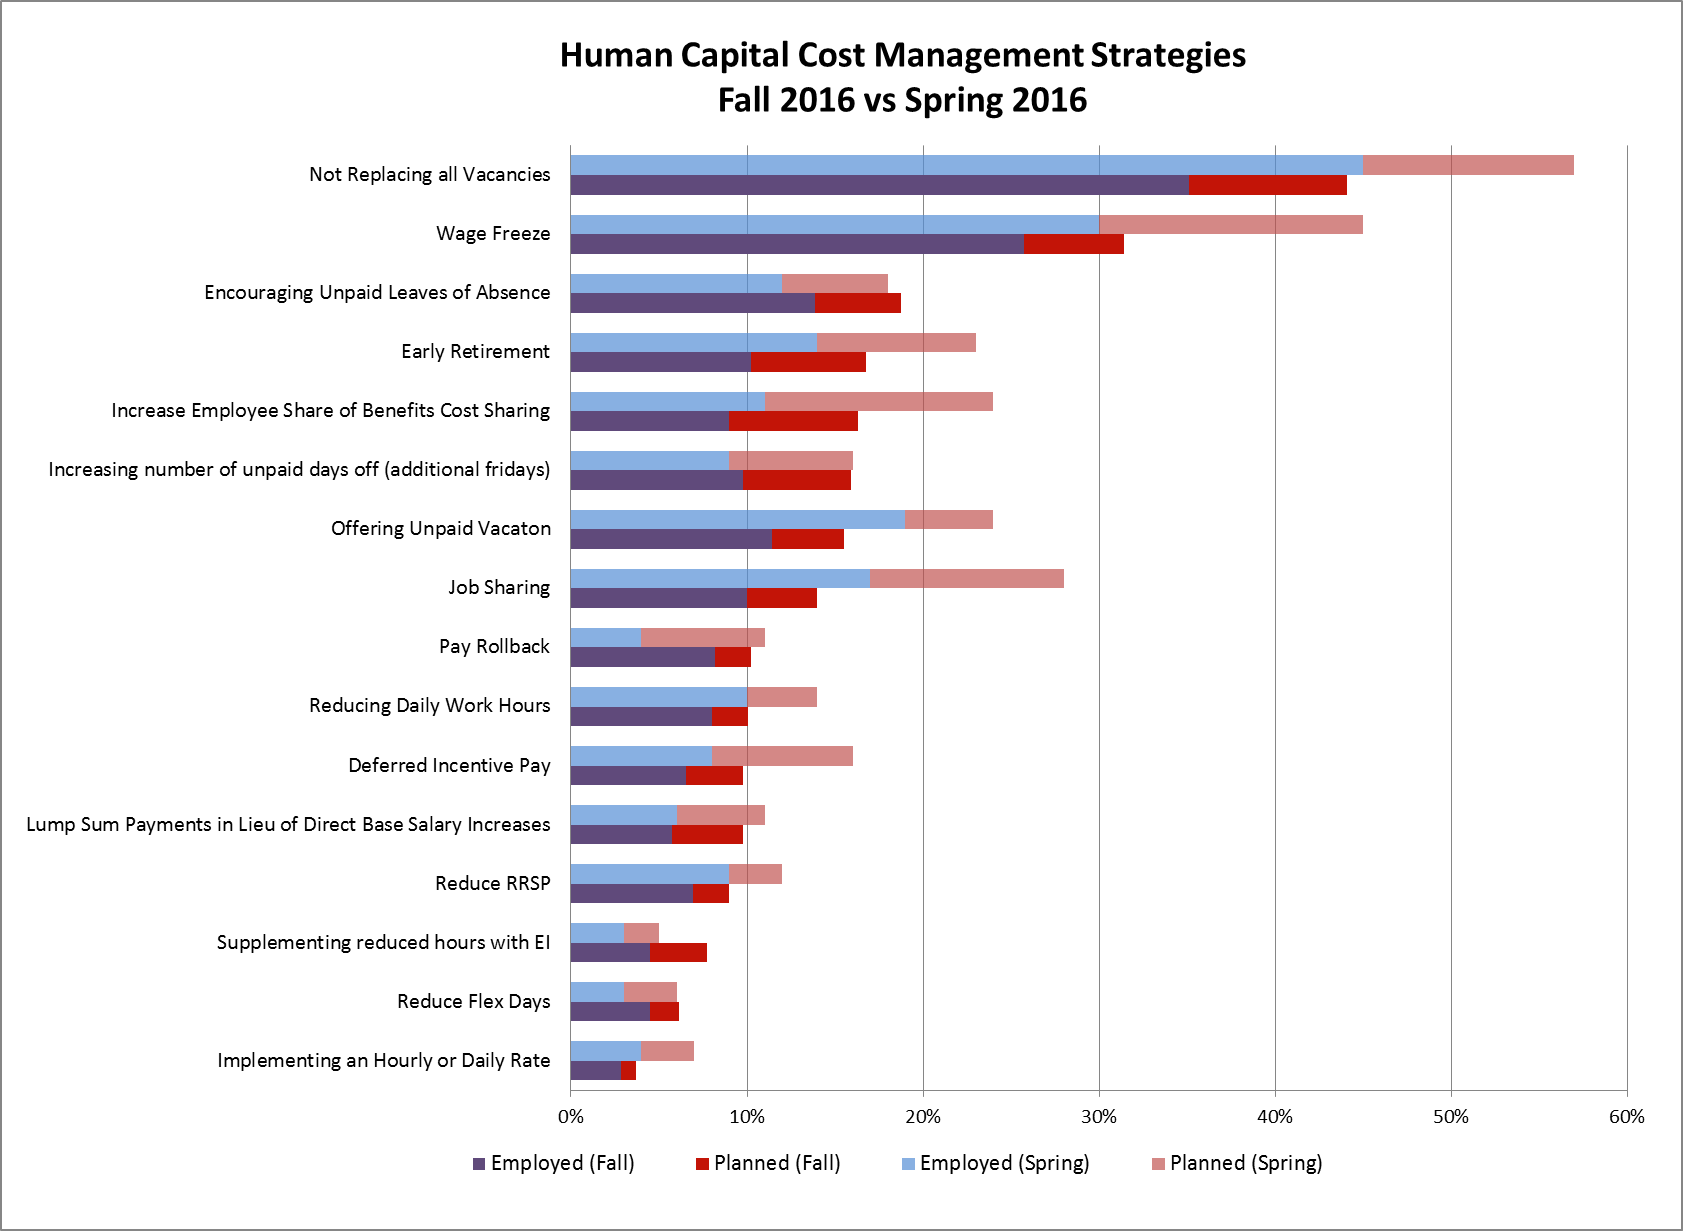
A key function of this survey is not only to report on what organization's expect of the economy, but how they are dealing with these expectations in terms of their human capital. During the past few years we have seen a significant uptick in the use of cost saving practices by organizations in order to balance their books while maintaining bench strength. These practices varied in both size and severity throughout Canada and have left many individuals with reduced hours, wage freezes, or layoffs. Although we are beginning to see a reduction in policies such as these, many organizations are still employing cost saving strategies that impact the work force. These strategies are highlighted in the graph below.
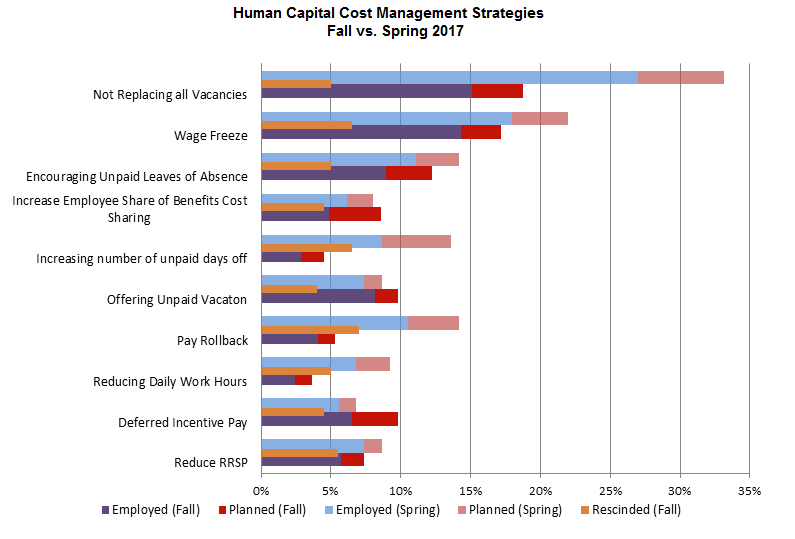
Many more participants are replacing current vacancies, rolling back wage freezes, and increasing the number of hours worked than were doing so during the spring of 2017.
- More than 75% of participants expect to replace future vacancies.
- Less than 20% of organizations have (or plan on) implementing wage freezes.
- Other cost saving strategies such as increased benefit cost sharing, increase unpaid vacation, and pay rollbacks are still being used, however, at a much lesser rate than previously reported.
- Averaging at 5% across the board, companies seem to be rolling back cost cutting measures with expectations of growth in 2018.
For more detailed insights and in-depth data, please see our annual Canadian Salary Surveys.
The Storm Has Passed
Compensation Trends and Forecasts for Summer 2017
Prepared By: The Wynford Group
June 2017
The information presented in this report is a short sampling of results and interpretation of a survey
submitted by over 200 participants from across Canada, compiled between April and June of 2017.
The focus of the survey was on actual salary adjustments and impacts to compensation trends in 2017.
We hope you find these results valuable, and encourage you to contact us for more information or to learn how the Wynford Group
can work with your organization for any compensation or management consulting requirements. For more detailed insights and in-depth data,
please see our annual Canadian Salary Surveys. Please click here for more information.
Economic Overview
- Analysts have boosted forecasts for the British Columbia economy, leading provincial growth at 3.0% for 2017.
- The Alberta economy is showing definite signs of recovery in 2017 with GDP expected to be 2.9% for 2017. This growth is expected to continue to a country leading 3.4% in 2018 when the recovery is expected to be in full swing.
- Ontario is following closely behind with growth of 2.7% expected for 2017.
- Atlantic Canada still faces hard times with economic forecasts suggesting low levels of growth, and even economic contractions. Forecasted for two more years of recession, Newfoundland & Labrador faces -2.2% for 2017 followed by -0.4% in 2018.
Summarized in the graph below are our participant's expectations on how they see their businesses performing in the summer months of 2017.
Overall, the results of these responses indicate a positive outlook for economic growth and maintained levels of business for the majority of participants.
We believe that these figures indicate a recovering economy, albeit a slow recovery with a long road ahead.
Actual 2016 Salary Increases
Highest Average Regional 2017 Base Salary Projection Increases (Including 0's):
|
National |
1.72 |
|
British Columbia |
2.00 |
|
Ontario |
1.81 |
|
Quebec |
1.73 |
|
Alberta |
1.55 |
Average Industry 2017 Base Salary Projection Increases (including 0's):
|
|
Highest |
|
Lowest |
|
Insurance |
2.39 |
Energy |
1.85 |
|
Professional Services |
2.39 |
Energy Services |
1.78 |
|
EPC/EPCM |
2.27 |
Mining |
1.75 |
|
Architecture |
2.25 |
IT Service |
1.55 |
|
Advanced Technology |
2.23 |
Not For Profit |
1.25 |
Average Regional 2017 Base Salary Increases (Excluding 0's):
|
National |
2.25 |
|
British Columbia |
2.38 |
|
Alberta |
2.08 |
|
Saskatchewan |
2.02 |
|
Manitoba |
1.99 |
|
Ontario |
2.31 |
|
Quebec |
2.15 |
|
Atlantic |
2.04 |
|
Northern Canada |
1.96 |
Average 2017 Base Salary Increases by Industry (Excluding 0's):
|
|
Highest |
|
Lowest |
|
Insurance |
2.58 |
Not For Profit |
1.93 |
|
Architecture |
2.50 |
Energy |
1.90 |
|
Hospitality |
2.50 |
Retail |
1.90 |
|
Professional Services |
2.40 |
Energy Services |
1.85 |
|
Financial |
2.38 |
IT Service |
1.65 |
Human Capital Practices
Highlights of the table above are as follows:
Human Capital Cost Management Strategies
A key function of this survey is not only to report on what organizations expect of the economy, but how they are dealing with these expectations in terms of their human capital. The Wynford Group aims to provide employers with options when exploring human capital cost savings. For several years we have asked participants which of the following cost saving strategies they currently have in place, or plan on using in the coming months. This helps gauge the common techniques used in today's market, and how they have adapted over time. Below is a graph of these results.
The graph above provides participants a summary of the cost management strategies currently being used in Canada to save on human capital.
The figures above tell us a story of the market for labor, as well as the overall health of our participant organization's businesses. Since our previous Flash Survey in Fall 2016,
all cost reducing strategies for human capital have decreased.
For more detailed insights and in-depth data, please see our annual Canadian Salary Surveys.
2017 Wynford Surveys & Salary Projections
What a Difference Six Months Makes!
March 2017 | Prepared By: The Wynford Group
Gail Evans recently presented some highlights from the Wynford Group?s
salary projection survey completed in late 2017 with over 240 participants from across Canada. We are expecting these projections to be reflected in the actual
survey responses being gathered now in our Canadian Salary Surveys.
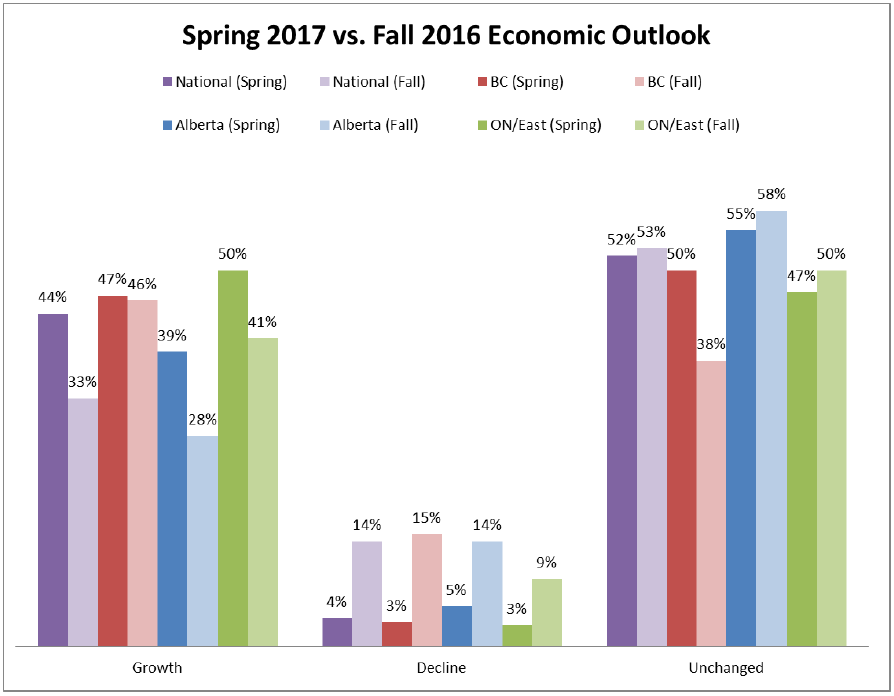
Economic Overview
The chart below indicates that there has been a marked change in the confidence in the economy across the country. For Alberta, the flip is most dramatic: 14% increase in confidence of growth and a whopping 23% decrease in companies expecting a decline in business.
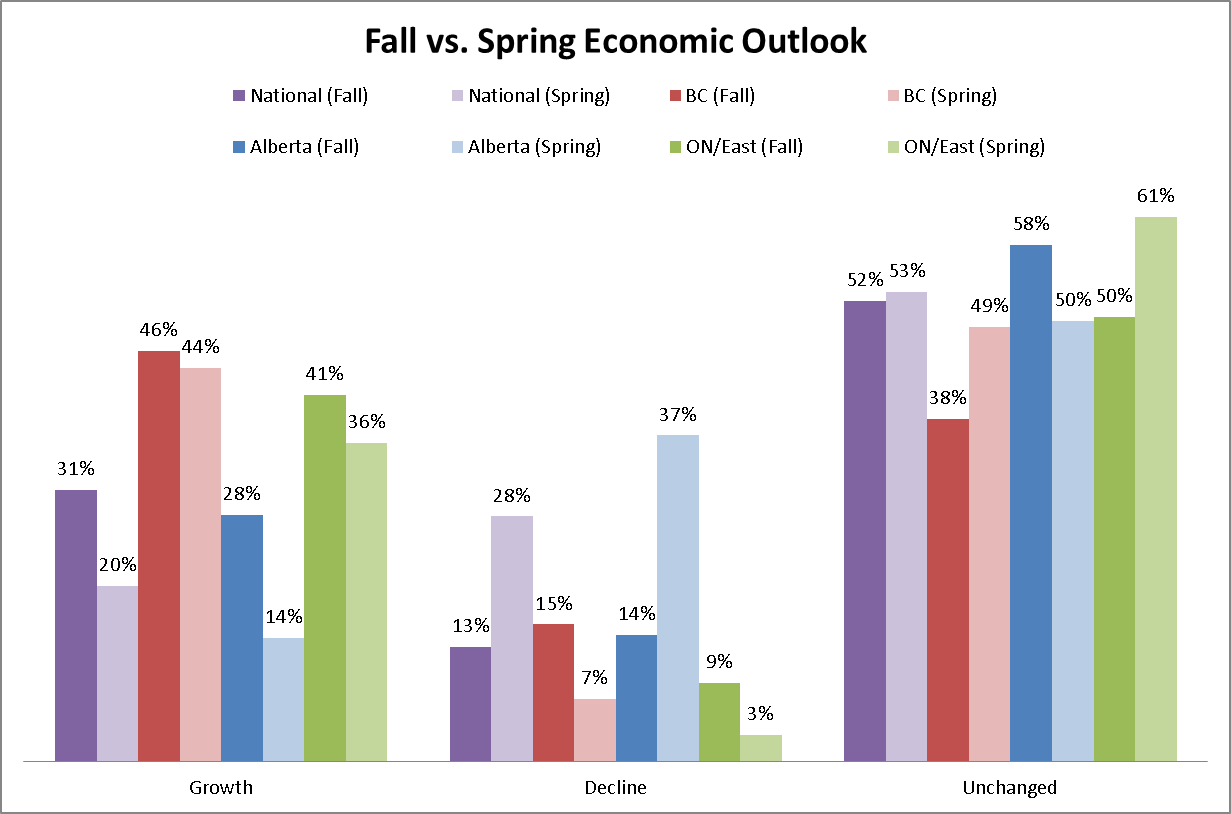
This prediction is consistent with the recent Conference Board of Canada
projection that Alberta will lead provinces in economic growth in 2017 to work towards recovery from the recession in the last 2 years and provide a more balanced narrative
on the Canadian economy as a whole.
With oil prices holding steady at around $55/bbl. and multiple pipeline projects being approved, oil producing provinces are beginning to show increased optimism for 2017.
However, the labour market is expected to slowly strengthen rather than bounce back. British Columbia and Ontario are expected to see sustained growth in 2017; however, there
is an expectation that these provinces will see slightly less growth than in the previous year due to the potential impact of new U.S. trade discussions and measures taken
regarding the hot housing markets.
Actual 2017 Salary Increases
Highest Average Regional 2017 Base Salary Projection Increases:
|
|
Highest |
|
Lowest |
|
CANADA |
2.00 |
Manitoba |
1.90 |
|
British Columbia |
2.25 |
Alberta |
1.75 |
|
Ontario |
2.06 |
Atlantic |
1.75 |
|
Quebec |
1.92 |
Saskatchewan |
1.72 |
Average Industry 2017 Base Salary Projection Increases (including 0?s):
|
|
Highest |
|
Lowest |
|
Advanced Technology |
2.75 |
Mining |
1.75 |
|
Insurance |
2.25 |
Construction |
1.74 |
|
Professional Services |
2.15 |
Hospitality |
1.68 |
|
Financial |
2.14 |
Energy |
1.65 |
|
Software Development |
2.10 |
IT Services |
1.58 |
*Please note that these figures include reported 0?s for base salary projection increases.
Salary Increases are More Balanced
The above indicates that the divergence in salary increases between industries is narrowing. In comparison to the Spring Flash Update, the
difference between the highest and the lowest projected increases was over 5.5%, while the Fall difference is only 1.17%. The Wynford Group
attributes this to the slow bounce back in the energy sector, as well as a leveling out in some industries such as software development and mining.
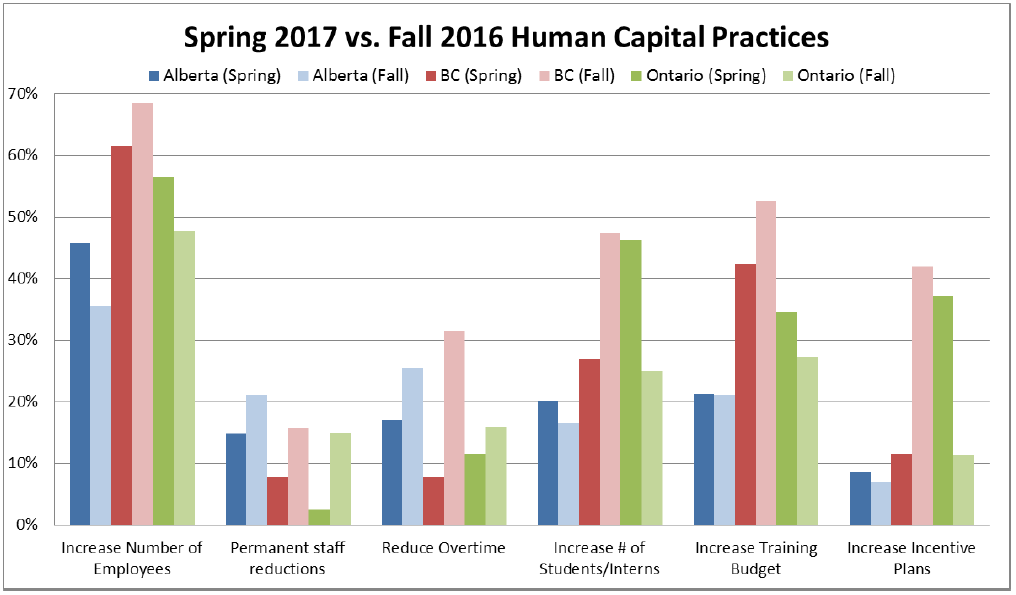
Human Capital Practices

Cautious but Optimistic
When emerging from a recession, one of the slowest areas of the economy to catch up is often the labour market. Typically lagging behind as investor confidence and company
revenues rebound, positive movement in the labour market is a harbinger of better times ahead.
The chart above indicates:
The instances of hiring freezes have dropped, yet a number of organizations are maintaining this strategy, therefore indicating that caution is still in place.
Human Capital Cost Management Strategies
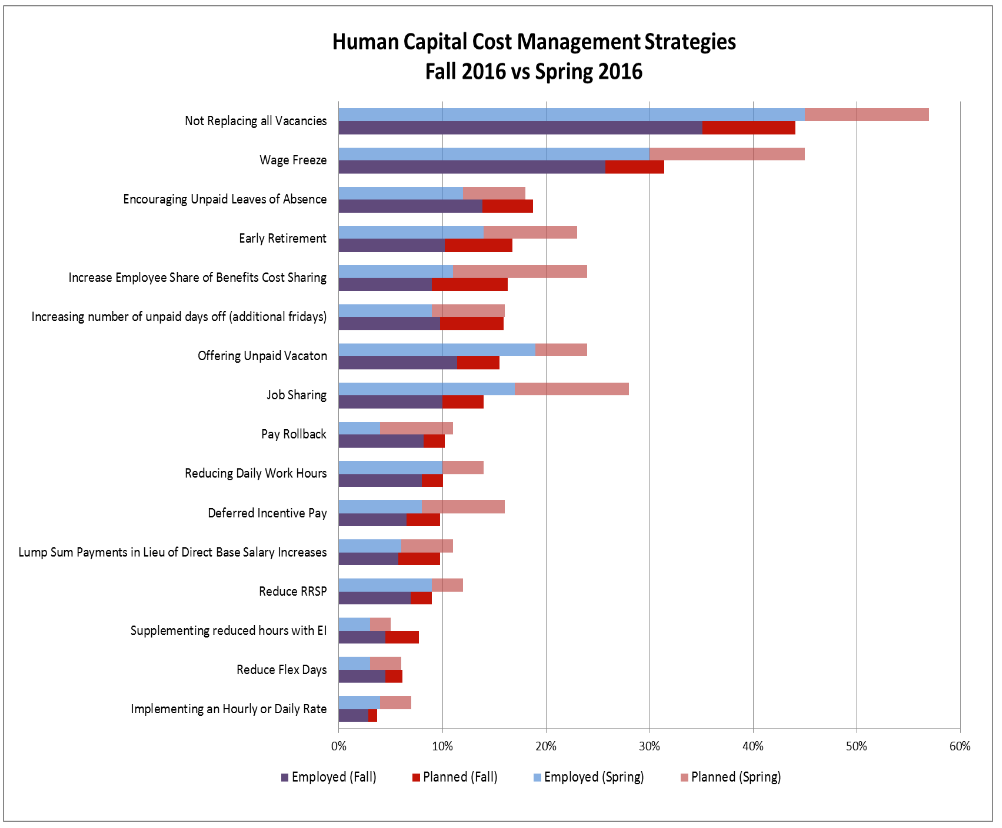
The worst has passed!
Many organizations that were hard hit by the recession chose some innovative ways to reduce costs yet maintain ?bench strength? of skilled workers. The chart above
indicates that the majority of these were implemented in Spring 2016 and fewer organizations were looking at these approach by late Fall 2016.
Flexibility will be Key
We project that there will be quite a different picture in Spring of 2017, when companies who had rolled back salaries are expected to start reversing that strategy.
We also believe that we are entering a period when Flexibility in responding to economic and other issues will be critical in fine-tuning Total Rewards strategies in the immediate future.
For more detailed insights and in-depth data,
please see our annual Canadian Salary Surveys.
Please click here for more information.
Looking Forward: Cloudy with Scattered Sun
Total Rewards Insights and Forecasts for 2017
January 2017 | Prepared By: The Wynford Group
The information presented in this report is a summary of results and interpretation of a survey completed by over 240 participants from across Canada, compiled between October and December of 2016. The focus of the survey was on actual salary adjustments and impacts to compensation trends in 2017.
We hope you find these results valuable, and encourage you to contact us for more information or to learn how the Wynford Group can work with your organization for any compensation or management consulting requirements. For more detailed insights and in-depth data, please see our annual Canadian Salary Surveys.
Please click here for more information.
Economic Overview
Needless to say, 2016 was a year of uncertainty for most Canadians.
With scattered layoffs throughout the country, the majority of Canadian provinces experienced increased unemployment rates carrying over from 2015. As a particularly
negative benchmark for 2016, Alberta saw its highest unemployment rate in 22 years at 9.0% in November. Although provinces such as British Columbia and Ontario managed
to weather the storm, we look towards 2017 for a brighter and more balanced narrative on the Canadian economy as a whole.
With oil prices holding steady at around $55/bbl. and multiple pipeline projects being approved, oil producing provinces are beginning to show increased optimism for 2017.
However, the labour market is expected to slowly strengthen rather than bounce back entirely. British Columbia and Ontario are expected to see sustained growth in 2017; however,
there is an expectation amongst Economists that these provinces will see slightly less growth than in the previous year due to new regulations on their provincial housing markets.
Summarized in the graph below are our participant�s expectations on how they see their businesses performing in 2017.
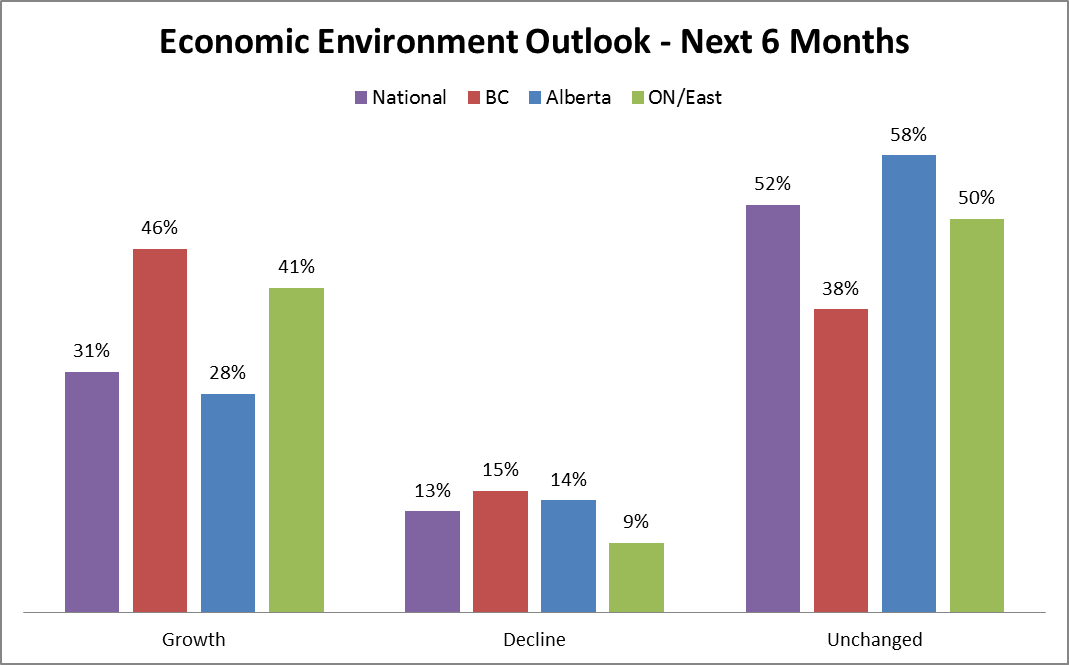
The Wynford Group believes that the graph above provides an
accurate reflection of how the Canadian Economy is expected to perform in the coming months. We have seen a reduction in the number of participants expecting a
decline in business, as well as a modest increase in those expecting growth. In comparison to spring 2016, the following highlights suggest a brighter year for 2017:
Overall our participants are forecasting a better year for business in 2017. Although there will always be areas of uncertainty; whether it be domestic government policy,
political change in the United States, or the ever-frustrating actions of OPEC, our economy is moving forward and optimism on the rise.
Actual 2017 Salary Increases
Highest Average Regional 2017 Base Salary Projection Increases:
|
|
Highest |
|
Lowest |
|
British Columbia |
2.25 |
Saskatchewan |
1.72 |
|
Ontario |
2.06 |
Alberta |
1.75 |
|
Quebec |
1.92 |
Atlantic |
1.75 |
|
Manitoba |
1.90 |
Average Industry 2017 Base Salary Projection Increases (including 0�s):
|
|
Highest |
|
Lowest |
|
Advanced Technology |
2.75 |
Mining |
1.75 |
|
Insurance |
2.25 |
Construction |
1.74 |
|
Professional Services |
2.15 |
Hospitality |
1.68 |
|
Financial |
2.14 |
Energy |
1.65 |
|
Software Development |
2.10 |
IT Services |
1.58 |
The above indicates that the divergence in salary increases between industries
is narrowing. In comparison to the Spring Flash Update, the difference between the highest and the lowest projected increases was over 5.5%, while the Fall difference is only
1.17%. The Wynford Group attributes this to the slow bounce back in the energy sector, as well as a leveling out between industries such as software development and mining.
*Please note that these figures include reported 0�s for base salary projection increases.
Human Capital Practices
When emerging from a recession, one of the slowest areas of the economy to catch
up is often the labour market. Typically lagging behind as investor confidence and company revenues rebound, positive movement in the labour market is a harbinger of better times
ahead. The chart above indicates:
The instances of hiring freezes have dropped, yet a number of organizations are maintaining this strategy, therefore indicating that caution is still in place.
Human Capital Cost Management Strategies
A key function of this survey is not only to report on what organizations expect of the economy, but how they are dealing with these expectations in terms of their human capital. During 2015-2016 we saw a significant uptick in the use of cost saving practices by organizations in order to balance their books while maintaining bench strength. These practices varied in both size and severity throughout Canada and have left many individuals with reduced hours, wage freezes, or layoffs. The Wynford Group aims to provide employers options to explore regarding human capital cost savings. For several years we have asked participants which of the following cost saving strategies they currently have in place, or plan on using in the coming months. Below is a graph of these results.
As can be seen in the results above, participants responded in the spring of 2016 as
having implemented these cost saving strategies at a much higher rate. Not replacing all vacancies is a simple but effective strategy that the majority of participants have implemented in
the past year. However, these figures have decreased since. In line with both our Economic Environment figures and our Salary Adjustment statistics below, this graph follows the same
narrative of analysts and government officials alike; it seems as though the worst has passed.
For more detailed insights and in-depth data,
please see our annual Canadian Salary Surveys.
Please click here for more information.
Highlights: Wynford Group Flash Survey
2015 Recession & Impacts on Human Capital
January 2016 | Prepared By: The Wynford Group
This report provides highlights of the results and interpretation of the Flash survey of over 300 participants from across Canada, compiled in December 2015. The focus of the survey was on salary projections for 2016 and impacts to compensation trends resulting in the current economic state.
Economic Overview
The Canadian economy continues to be at a slow simmer with pockets
of slightly hotter or colder
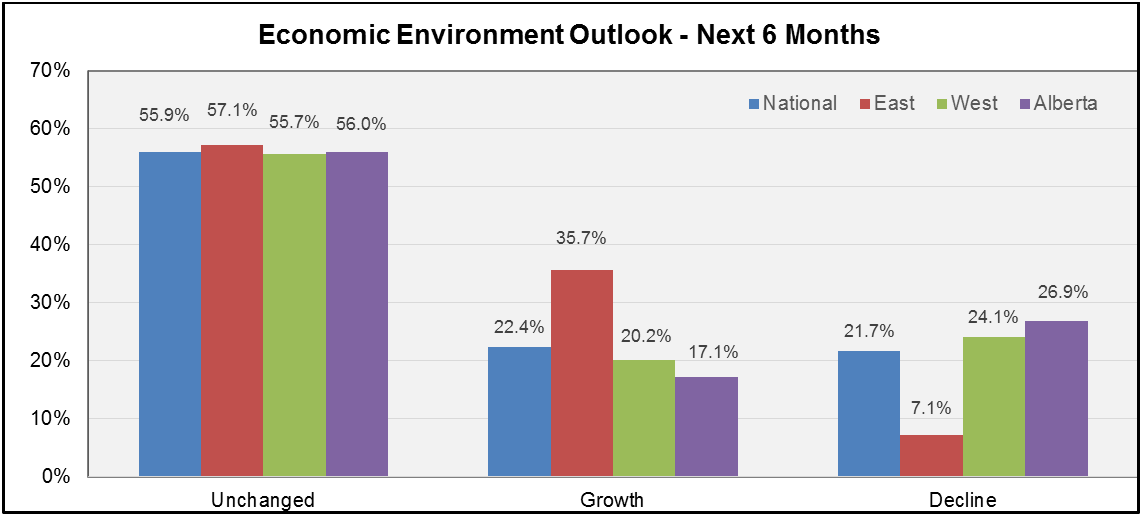
activity. Although approximately half of the participating organizations reported no change to the 2016 economic outlook over 2015,
organizations operating in the Western provinces tend to be less optimistic. This trend is most dramatic in Alberta, followed by Saskatchewan.
Conversely, most participants from Eastern Canada expect no change or growth over last year (92.9%).
A trend we are seeing nationally is a sharp cut to hiring. Many companies are opting for a leaner workforce either by means of layoffs, permanent
reductions, or not replacing voluntary vacancies. As policies shift and the country (and world) learns to adapt to low oil prices, diversification
of our economy will be key, especially in sectors like advanced technology, engineering, and IT. The projections in this survey indicate that these
areas are poised to have a stronger 2016.
As the sharp retraction in new energy projects in Northern Alberta would indicate, salaries in the resource rich provinces are showing lower increases in 2016 than in previous years. The results from this survey indicate that salary increases are markedly more modest across Canada than what was projected for 2015. We are also seeing significantly more reported zeros, which confirms that many companies are opting out of or deferring general increases for the time being.
Average Regional 2016 Base Salary Projection Increases:
|
|
Reported 0�s Included |
|
Reported 0�s Omitted* |
|
Canada |
1.99 |
Canada |
2.54 |
|
British Columbia |
2.21 |
British Columbia |
2.64 |
|
Ontario |
2.15 |
Ontario |
2.62 |
|
Quebec |
2.03 |
Quebec |
2.51 |
|
Manitoba |
1.87 |
Manitoba |
2.44 |
|
Saskatchewan |
1.79 |
Saskatchewan |
2.30 |
|
Atlantic Canada |
1.74 |
Atlantic Canada |
2.25 |
|
Alberta |
1.45 |
Alberta |
2.08 |
*Please note that 2 versions of salary projections have been provided:
� Reported 0's included - displaying all organizations including 0's (no increase) and salary rollbacks
- Reported 0's omitted - displaying only organizations that have provide increases above 0%
Average Industry 2016 Base Salary Projection Increases (including 0's):
|
|
Highest |
|
Lowest |
|
Advanced Technology |
2.82 |
Manufacturing |
1.79 |
|
Utilities |
2.78 |
Logistics/Distribution |
1.69 |
|
Financial Services |
2.54 |
Retail |
1.48 |
|
Professional Services |
2.42 |
Construction |
1.37 |
|
IT Service Providers |
2.09 |
EPC / EPCM |
1.17 |
|
Mining |
2.04 |
Engineering |
0.94 |
|
Architecture |
1.97 |
Energy |
0.62 |
|
Not for Profit, Public Sector |
1.83 |
Energy Services |
0.36 |
The above indicates a significant change in increases by industry and location for 2016 compared to 2014 or 2015. Industries with strong links to energy (which in the past have typically received the highest increases) have now flipped to the bottom (Energy, Energy Services, and EPC). This is primarily a result of the number of organizations that have frozen or rolled back salaries, or deferred increases until the sector picks up again.
Human Capital Practices
The chart below illustrates trends in human capital practices since 2009. Projections for 2016 indicate a trend of overall reduction of staff, primarily by means of hiring freezes (28% of respondents) and permanent staff reductions (24% of respondents). Only 26% of respondents indicated they planned to increase staff numbers in 2016.
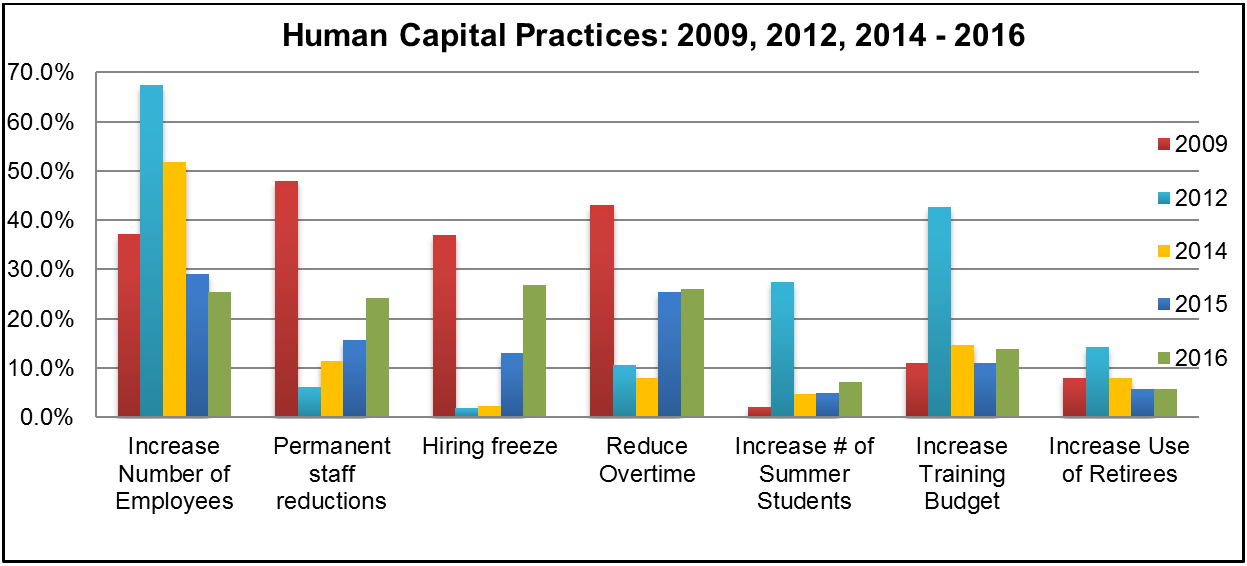
Periods of uncertainty almost always lead to cost constraints. While the above strategies are used to provide flexibility, the significant increases in layoffs or permanent staff reductions are a more serious potential indicator of structural change in some industries. Interestingly, training budgets have not dropped as dramatically as some other indicators, suggesting that there continues to be a focus on training to keep staff prepared for the next cycle.
Alternative Cost Management Strategies
As indicated above a number of organizations have experienced a
dramatic change in their economic situation. We therefore surveyed what alternative strategies they were using to cut costs and reduce the need for the reducing staff
numbers and compared these strategies to responses collected in our Spring 2015 survey.
Over half of all respondent indicated that they had implemented one or more of these strategies and 73% of respondents to this part of the survey had operations in Alberta.
More than half of all responding organizations are not replacing vacancies to reduce their workforce. Other common strategies to reduce human capital expenses were:
For more detailed insights and in-depth data from this or our annual Canadian Salary Surveys,
Please click here for more information.
Stay tuned for access to input documents for our 2016 surveys early next month!